| Abstract
|
Introduction
Receiver-operating characteristic (ROC) analysis was originally developed
during World War II to analyze classification accuracy in differentiating
signal from noise in radar detection. Recently, the methodology has been
adapted to several clinical areas heavily dependent on screening and diagnostic
tests, in particular, laboratory testing, epidemiology, radiology, and
bioinformatics.
ROC analysis is a useful tool for evaluating the performance of diagnostic
tests and more generally for evaluating the accuracy of a statistical
model (eg, logistic regression, linear discriminant analysis) that classifies
subjects into 1 of 2 categories, diseased or nondiseased. Its function
as a simple graphical tool for displaying the accuracy of a medical diagnostic
test is one of the most well-known applications of ROC curve analysis.
In Circulation from January 1, 1995, through December 5, 2005, 309 articles
were published with the key phrase "receiver operating characteristic."
In cardiology, diagnostic testing plays a fundamental role in clinical
practice (eg, serum markers of myocardial necrosis, cardiac imaging tests).
Predictive modeling to estimate expected outcomes such as mortality or
adverse cardiac events based on patient risk characteristics also is common
in cardiovascular research. ROC analysis is a useful tool in both of these
situations.
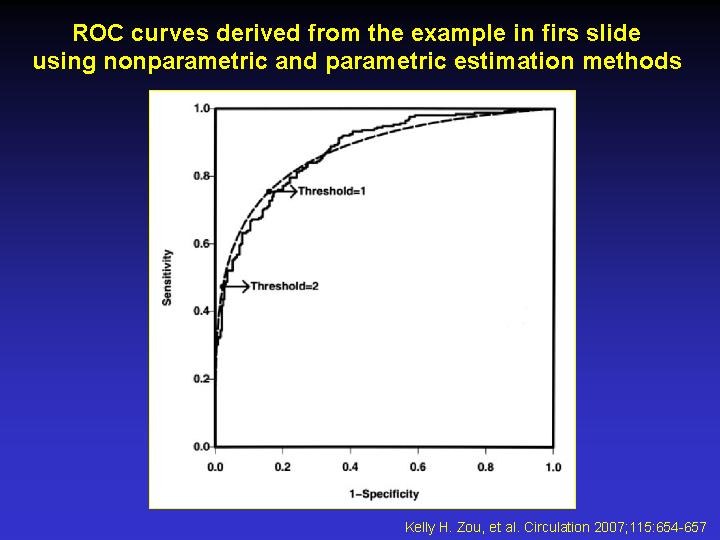
In this article, we begin by reviewing the measures of accuracy—sensitivity,
specificity, and area under the curve (AUC)—that use the ROC curve.
We also illustrate how these measures can be applied using the evaluation
of a hypothetical new diagnostic test as an example.
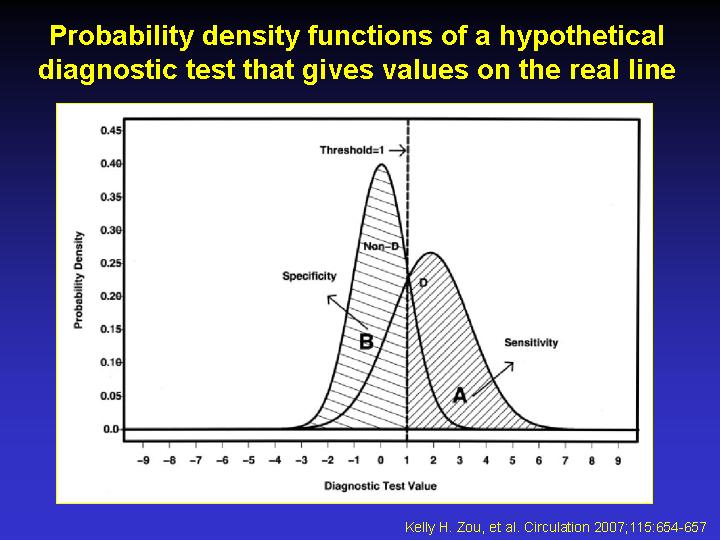
Sensitivity and Specificity
The fundamental measures of diagnostic accuracy are sensitivity (ie, true
positive rate) and specificity (ie, true negative rate). For now, suppose
the outcome of a medical test results in a continuous-scale measurement.
Let t be a threshold (sometimes called a cutoff) value of the diagnostic
test used to classify subjects. Assume that subjects with diagnostic test
values less than or equal to t are classified as nondiseased and that
subjects with diagnostic test values greater than t are classified as
diseased, and let m and n denote the number of subjects in each group.
Once the gold standard for each subject is determined, a 2x2 contingency
table containing the counts of the 4 combinations of classification and
true disease status may be formed; the cells consist of the number of
true negatives, false negatives, false positives, and true positives
Discussion
ROC analysis is a valuable tool to evaluate diagnostic tests and predictive
models. It may be used to assess accuracy quantitatively or to compare
accuracy between tests or predictive models. In clinical practice, continuous
measures are frequently converted to dichotomous tests. ROC analysis can
be used to select the optimal threshold under a variety of clinical circumstances,
balancing the inherent tradeoffs that exist between sensitivity and sensitivity.
Several other specific applications of ROC analysis such as sample size
determination and meta-analysis have been applied to clinical research.
These can be derived from the fundamental principles discussed here.
|