| Abstract
|
CONTEXT
High levels of lipoprotein(a) are associated with increased risk of myocardial
infarction (MI). Objective To assess whether genetic data are consistent
with this association being causal.
DESIGN, SETTING, AND PARTICIPANTS Three studies of white individuals from
Copenhagen, Denmark, were used: the Copenhagen City Heart Study (CCHS),
a prospective general population study with 16 years of follow-up (1991-2007,
n=8637, 599 MI events); the Copenhagen General Population Study (CGPS),
a cross-sectional general population study (2003-2006, n=29 388, 994 MI
events); and the Copenhagen Ischemic Heart Disease Study (CIHDS), a case-control
study (1991-2004, n=2461, 1231 MI events).
MAIN OUTCOME MEASURES Plasma lipoprotein(a) levels, lipoprotein(a) kringle
IV type 2 (KIV-2) size polymorphism genotype, and MIs recorded from 1976
through July 2007 for all participants.
RESULTS In the CCHS, multivariable-adjusted hazard ratios (HRs) for MI
for elevated lipoprotein(a) levels were 1.2 (95% confidence interval [CI],
0.9-1.6; events/10 000 person-years, 59) for levels between the 22nd and
66th percentile, 1.6 (95% CI, 1.1- 2.2; events/10 000 person-years, 75)
for the 67th to 89th percentile, 1.9 (95% CI, 1.2-3.0; events/10 000 person-years,
84) for the 90th to 95th percentile, and 2.6 (95% CI, 1.6-4.1; events/10
000 person-years, 108) for levels greater than the 95th percentile, respectively,
vs levels less than the 22nd percentile (events/10 000 personyears, 55)
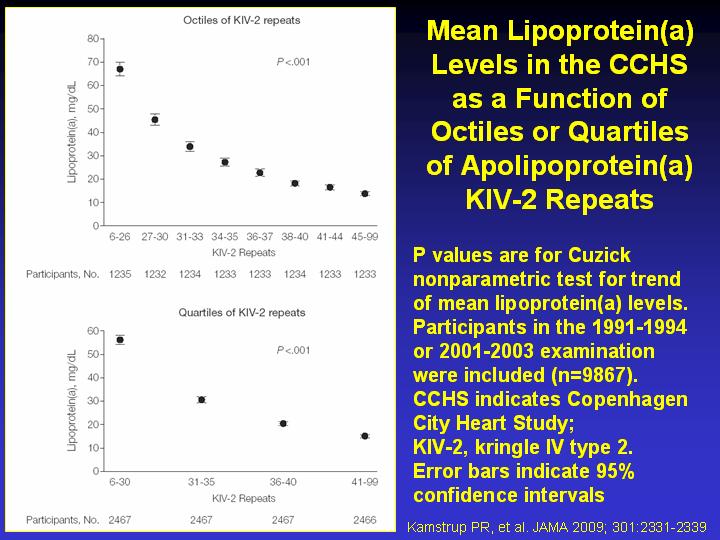
(trend P<.001). Numbers of KIV-2 repeats (sum of repeats on both alleles)
ranged from 6 to 99 and on analysis of variance explained 21% and 27%
of all variation in plasma lipoprotein(a) levels in the CCHS and CGPS,
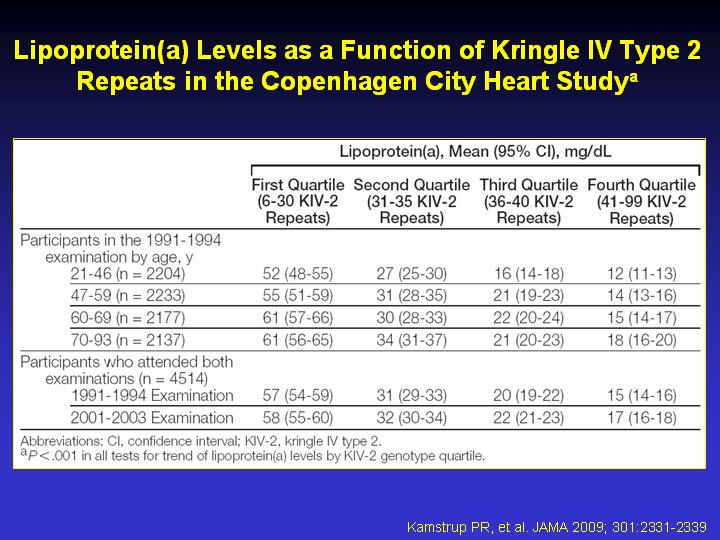
respectively. Mean lipoprotein(a) levels were 56, 31, 20, and 15 mg/dL
for the first, second, third, and fourth quartiles of KIV-2 repeats in
the CCHS, respectively (trend P<.001); corresponding values in the
CGPS were 60, 34, 22, and 19 mg/dL (trend P<.001). In the CCHS, multivariable-adjusted
HRs for MI were 1.5 (95% CI, 1.2-1.9; events/10 000 person-years, 75),
1.3 (95% CI, 1.0-1.6; events/10 000 person-years, 66), and 1.1 (95% CI,
0.9-1.4; events/10 000 person-years, 57) for individuals in the first,
second, and third quartiles, respectively, as compared with individuals
in the fourth quartile of KIV-2 repeats (events/10 000 person-years, 51)
(trend P<.001). Corresponding odds ratios were 1.3 (95% CI, 1.1-1.5),
1.1 (95% CI, 0.9-1.3), and 0.9 (95% CI, 0.8-1.1) in the CGPS (trend P=.005),
and 1.4 (95% CI, 1.1-1.7), 1.2 (95% CI, 1.0-1.6), and 1.3 (95% CI, 1.0-1.6)
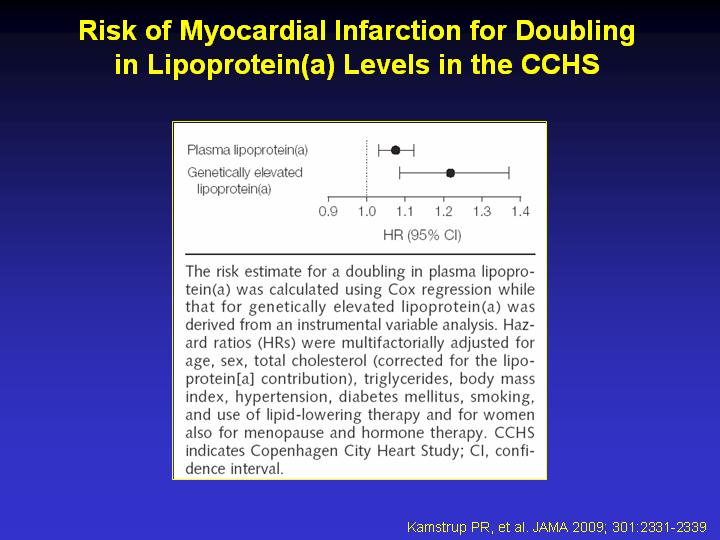
in the CIHDS (trend P=.01). Genetically elevated lipoprotein(a) was associated
with an HR of 1.22 (95% CI, 1.09-1.37) per doubling of lipoprotein(a)
level on instrumental variable analysis, while the corresponding value
for plasma lipoprotein(a) levels on Cox regression was 1.08 (95% CI, 1.03-1.12).
CONCLUSION These data are consistent with a causal association between
elevated lipoprotein(a) levels and increased risk of MI.
|